Setup
How to connect the Diagnostics Tool to your Erigon node
To monitor your node using the Diagnostic Tool, you must first establish a connection. The necessary steps to connect are:
- Run your Erigon node
- Run the Diagnostic Tool
- Create a new session in the Diagnostic Tool
- Connect the Diagnostic Tool to your node
- Refresh the Diagnostic Tool
1. Run your Erigon node
If you are not sure what to run, start from a testnet with Caplin as the Consensus Engine.
./build/bin/erigon --chain=holesky
2. Run the Diagnostics Tool
Run the Diagnostic Tool application from the machine where you intend to monitor your node.
cd diagnostics
make run-self-signed
The Diagnostics Tool page will automatically be available in your browser at the address http://localhost:8080.
Leaving the terminal session will close the Diagnostics Tool interface.
3. Create a new session in the Diagnostics Tool
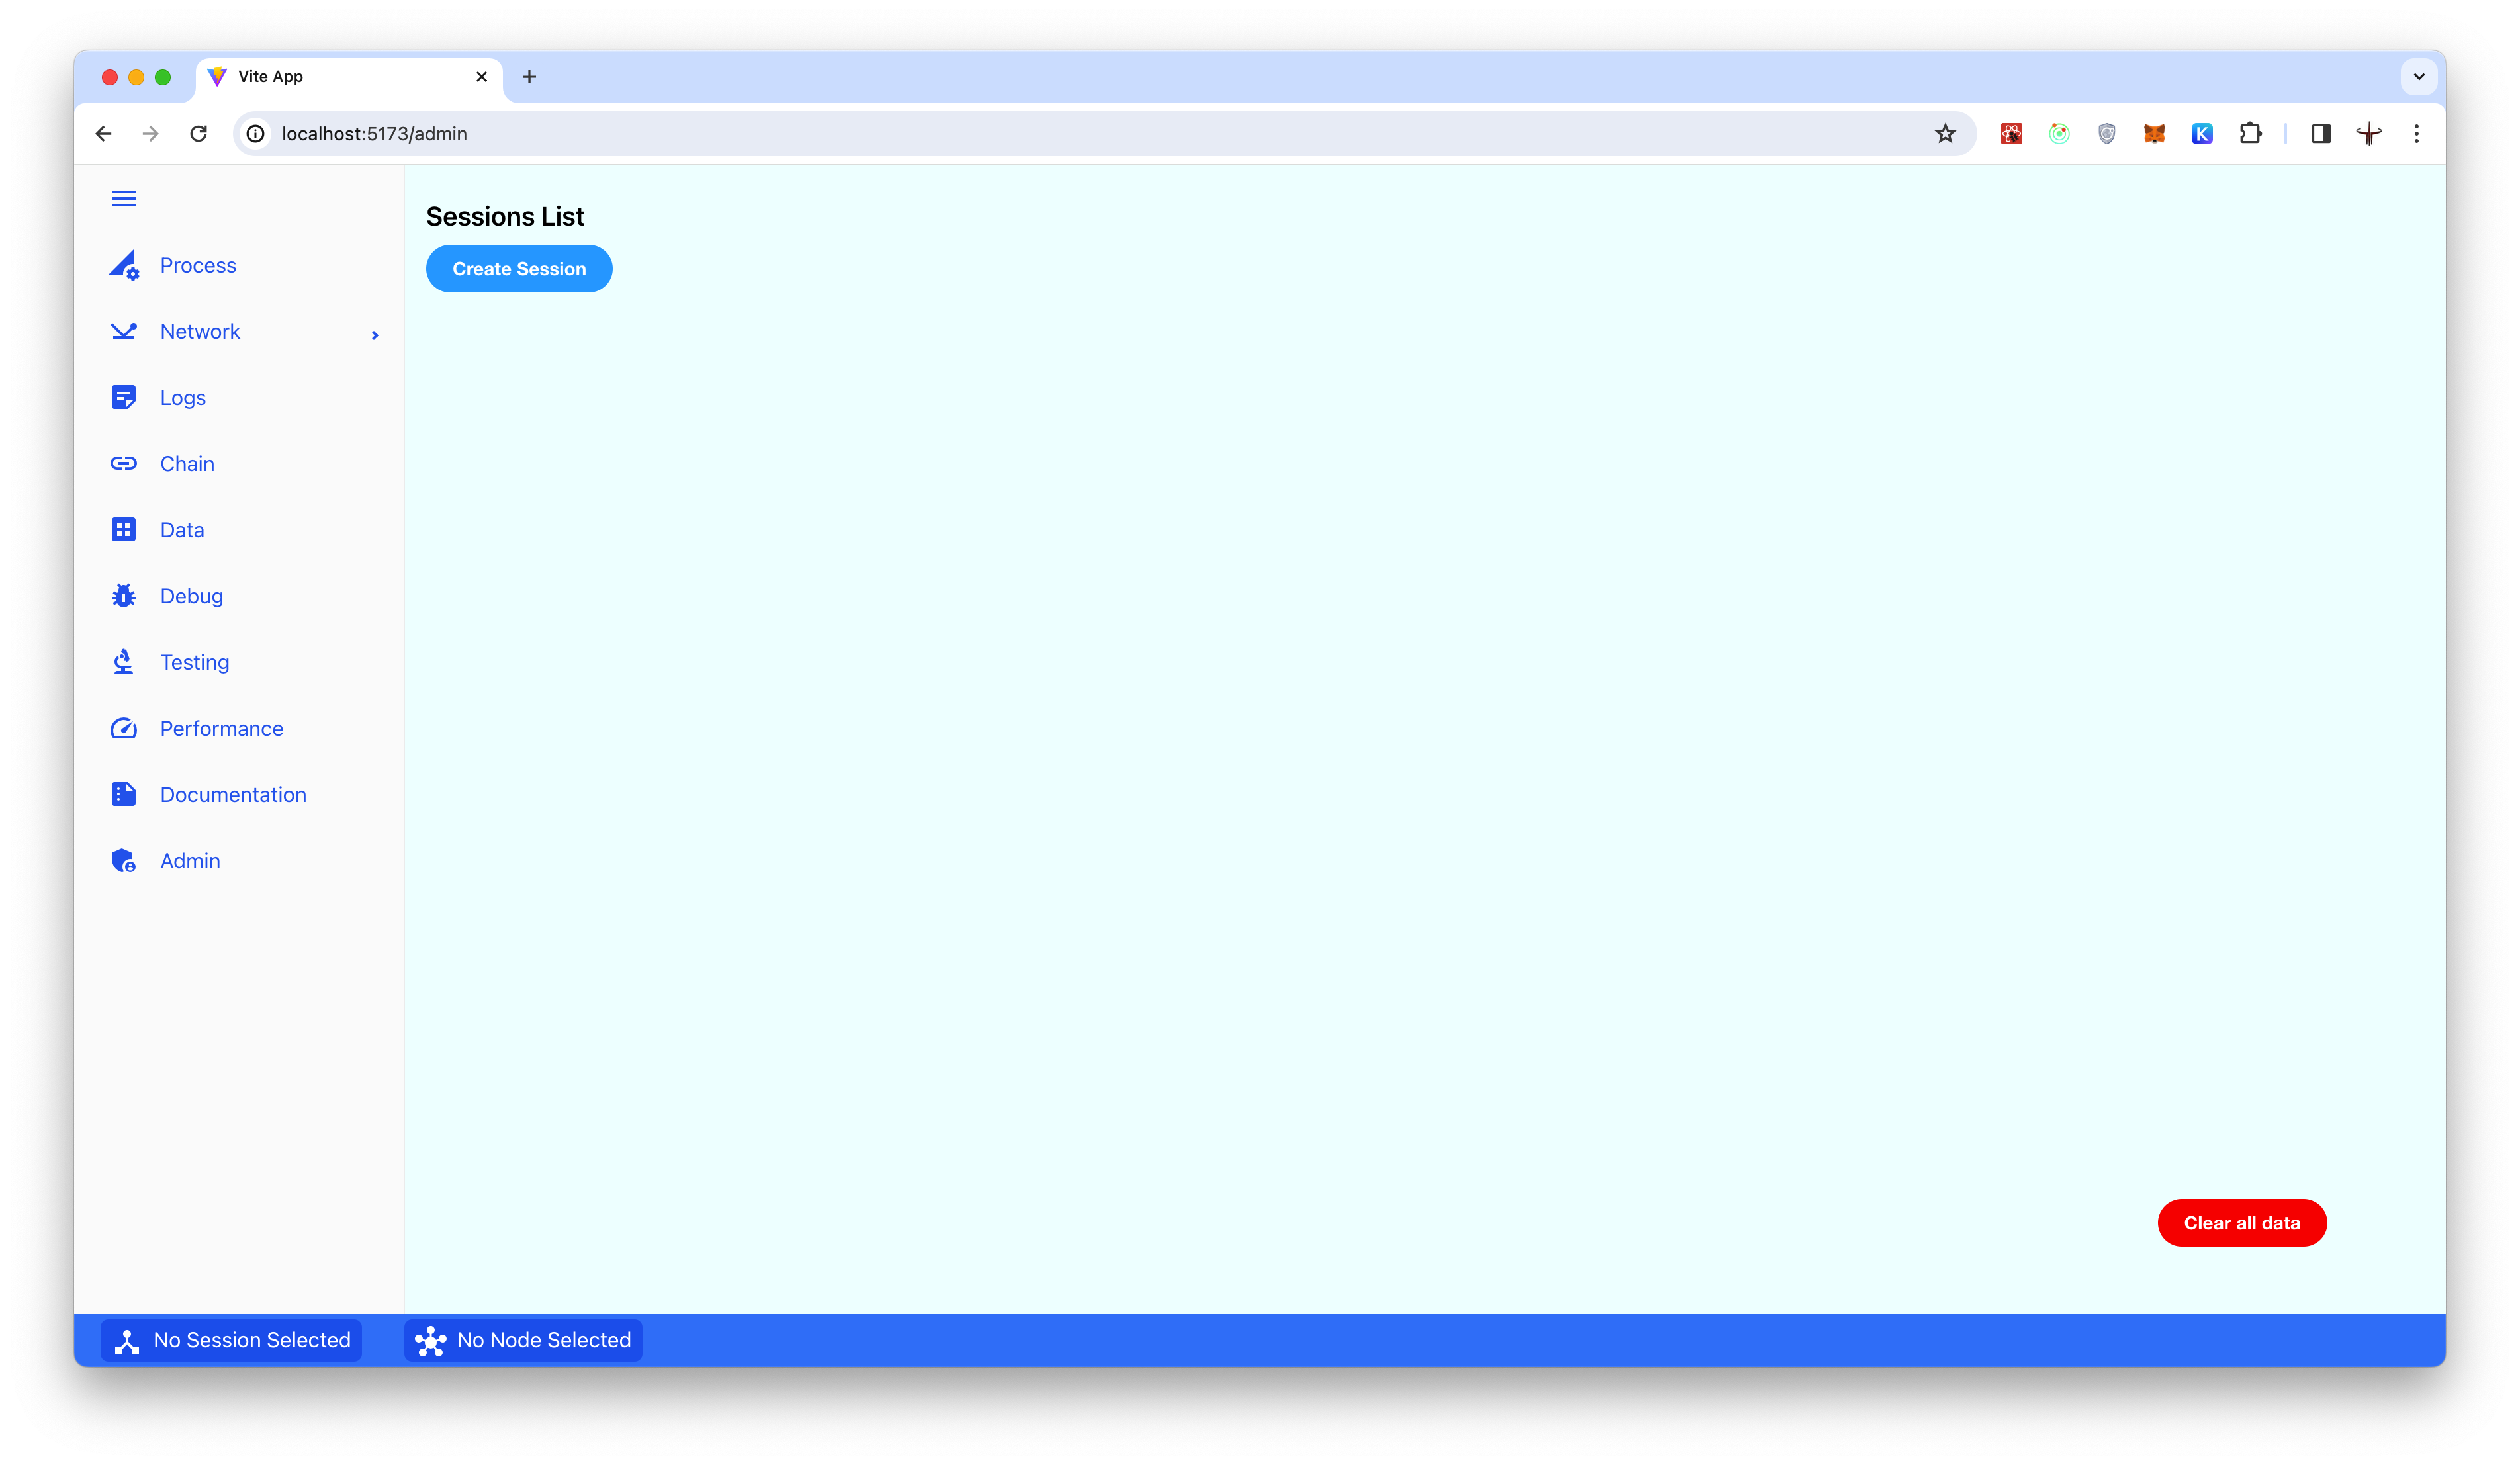
The Diagnostics Tool is now operational, but to access the data, it must be connected to the Erigon node. Proceed to the Admin section in the left navigation menu and select Create Session.
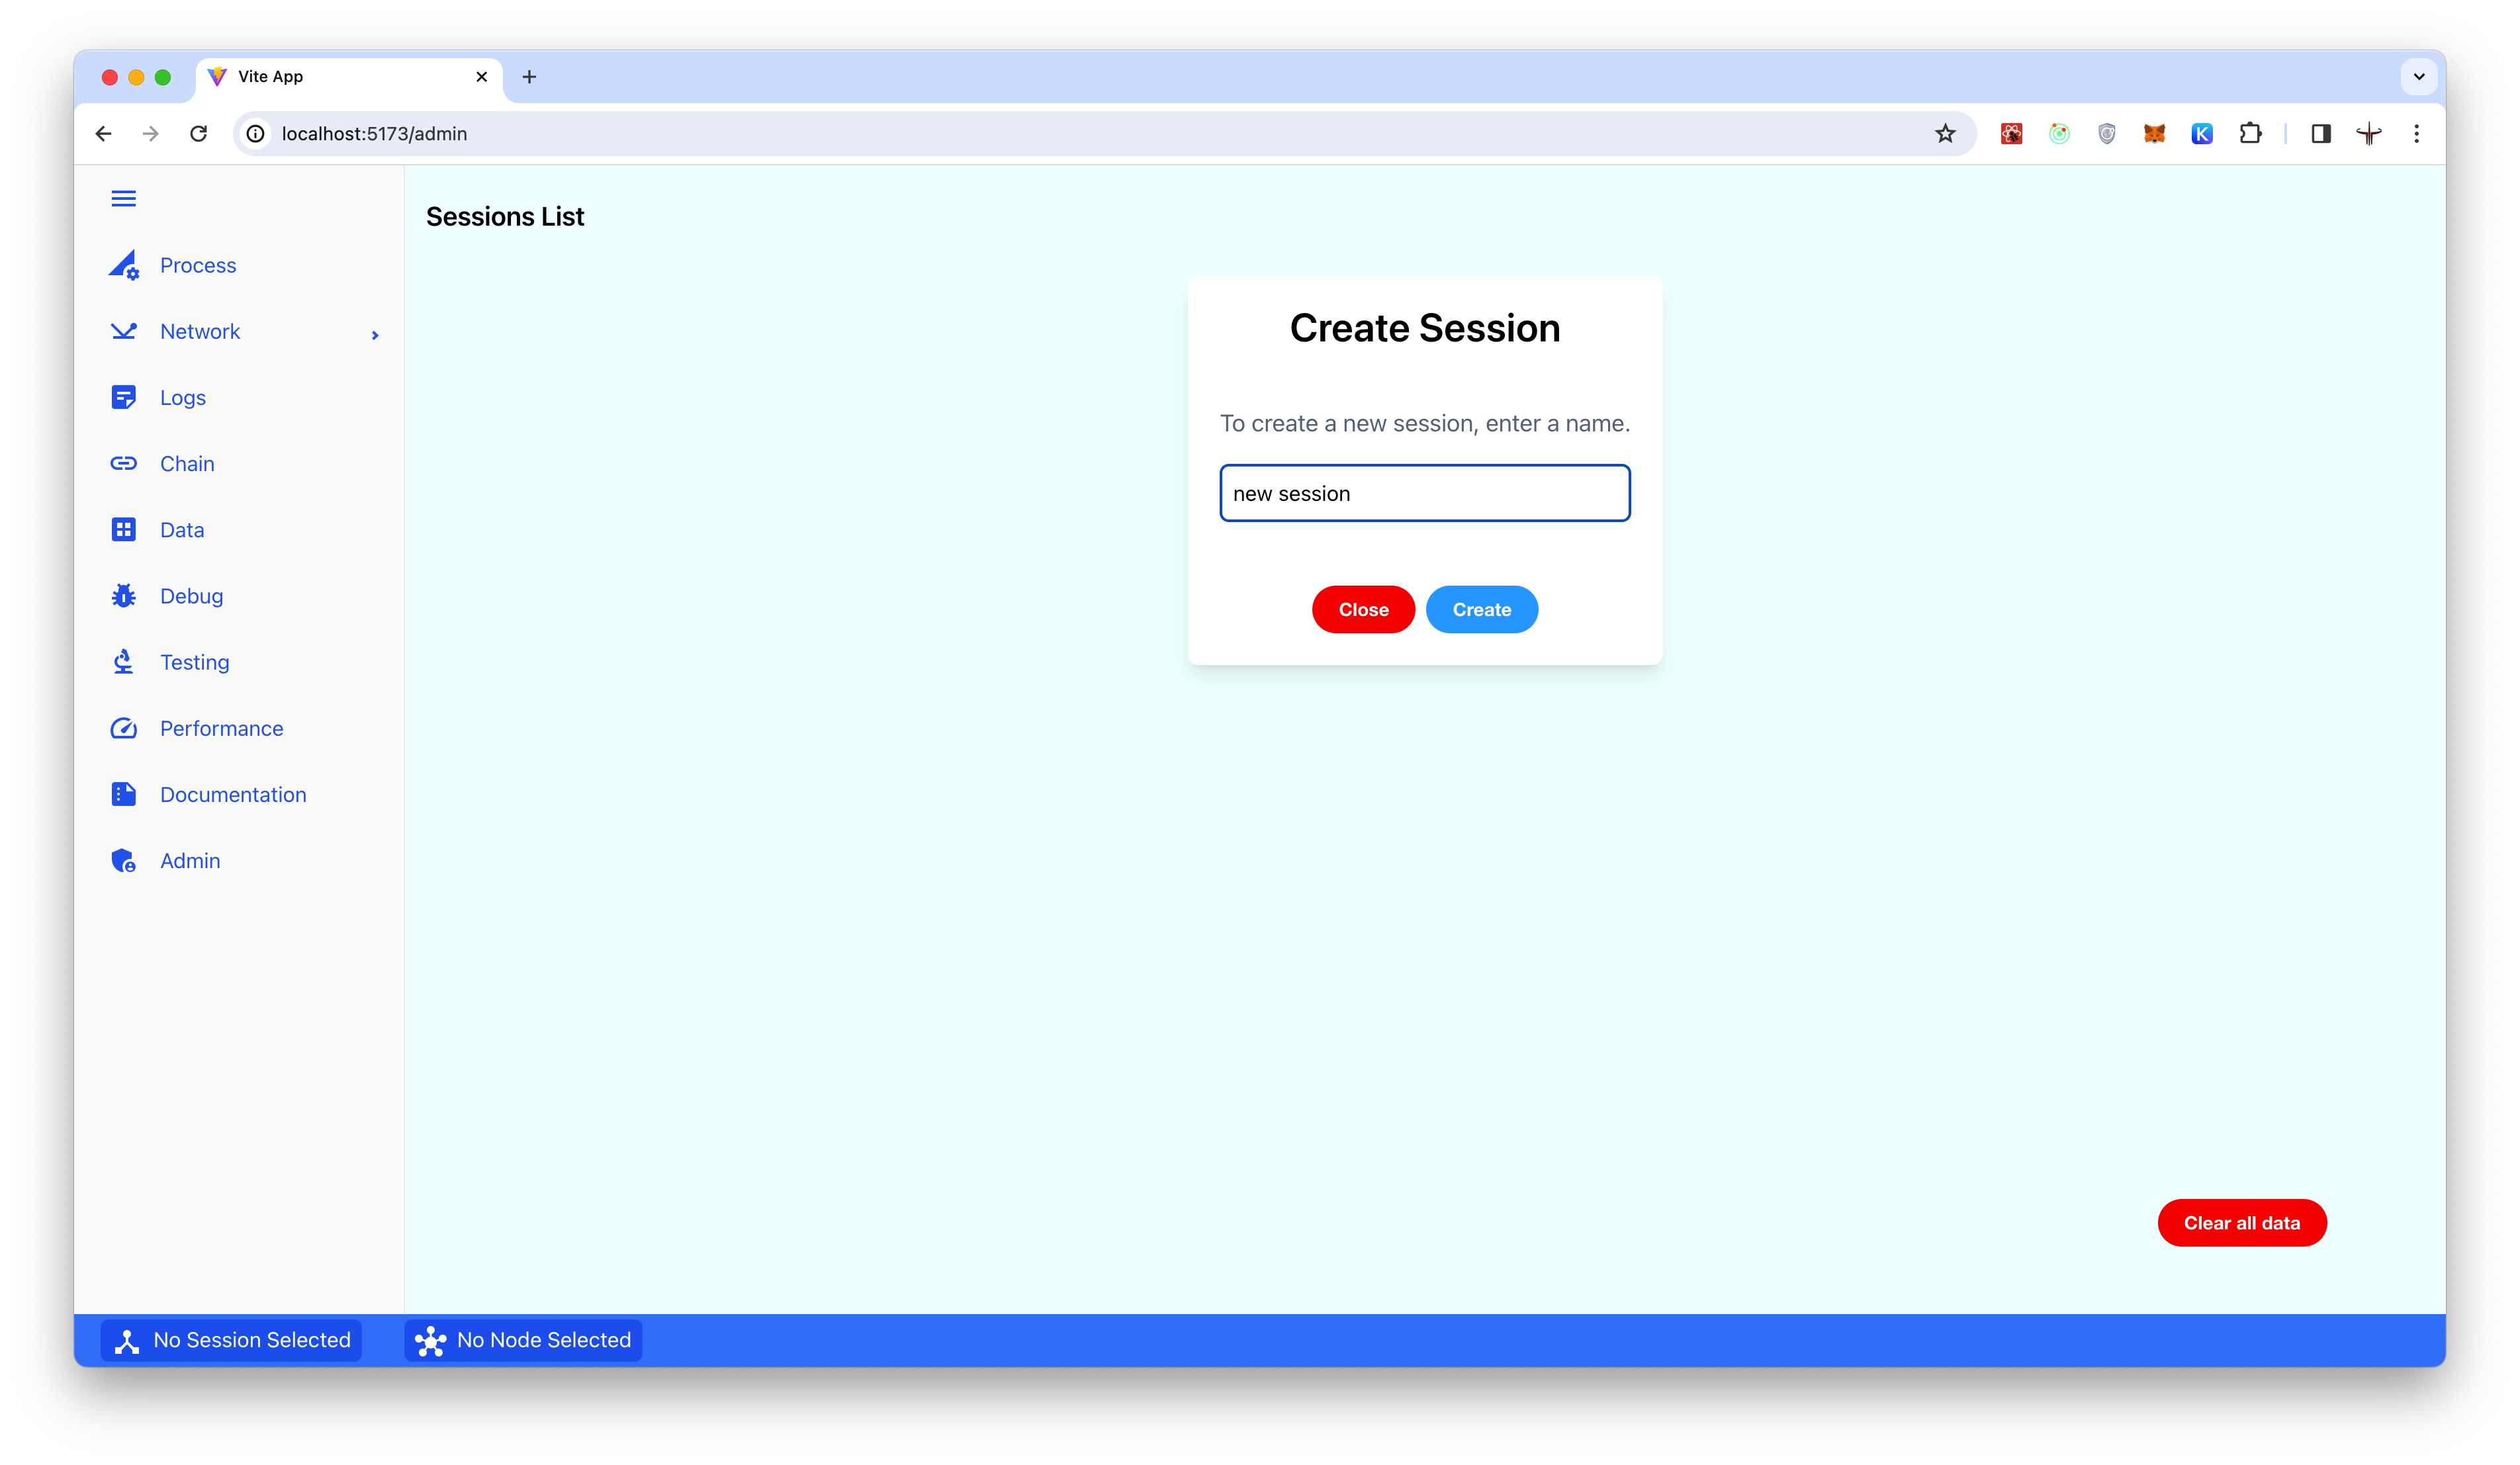
Assign a name to your session and click Create to proceed.
Upon successful creation of a new session, a unique 8-digit code, referred to as YOUR SESSION PIN, will be generated. You can find this PIN displayed next to the session name in the list of created sessions.
To copy the Session PIN or the support command, click on the copy button next to it. This will copy the information to your clipboard for easy reference or use.
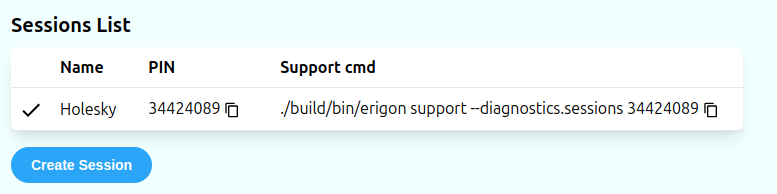
In this example, we created a session named "Holesky", and it was assigned the PIN 34424089. The corresponding support command is displayed beside the PIN:
./build/bin/erigon support --Diagnostics.sessions 34424089.
4. Connect the Diagnosticss Tool to your node
4.1 Local Node
If your Erigon node is running on your local machine, open a new console window in the Erigon folder and run the following command:
cd erigon
./build/bin/erigon support --diagnostics.sessions YOUR_SESSION_PIN
Replace YOUR_SESSION_PIN with the 8-digit PIN allocated to your session during the previous step, or use the suggested support command:
./build/bin/erigon support --diagnostics.sessions 34424089
This will attach the Diagnostics Tool to the Erigon node using the provided session PIN.
See also other options.
4.2 Remote Node
If your Erigon node is running on a Virtual Private Server (VPS) such as Amazon AWS, you can connect the Diagnostics Tool on your local machine with ngrok utility.
ngrok was chosen because of its easy of use and because the free version is useful for our scope. It is possible to use any other similar tool.
You can run ngrok on your local machine in order to tunnel localhost:8080:
ngrok http http://localhost:8080
The ngrok utility will start and return a page similar to the below example:
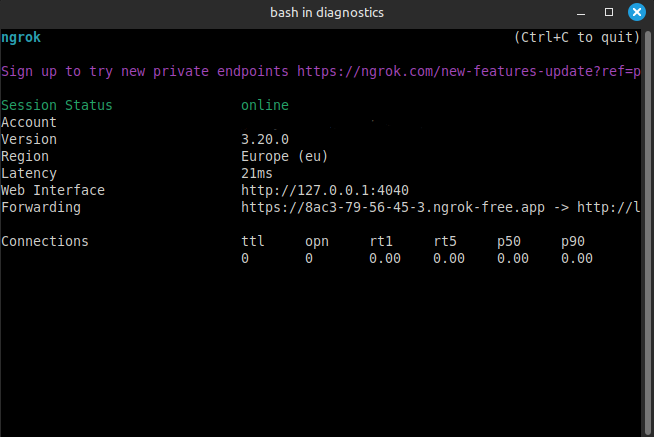
Your diagnostic address is in the Forwarding field. Copy only the part of the address after the URL prefix https://, in this case 8ac3-79-56-45-3.ngrok-free.app.
In the machine hosting your Erigon node, go to the Erigon directory and run this command to attach the Diagnostics Tool to the Erigon node:
./build/bin/erigon support --diagnostics.addr YOUR_DIAGNOSTIC_ADDRESS --diagnostics.sessions YOUR_SESSION_PIN
Replace YOUR_DIAGNOSTIC_ADDRESS with the address obtained with ngrok amd YOUR_SESSION_PIN with your session PIN from point 3. For example:
./build/bin/erigon support --diagnostics.addr 8ac3-79-56-45-3.ngrok-free.app --diagnostics.sessions 34424089
By following these steps, you can establish a connection between the Diagnostic Tool on your local machine and the Erigon node running on the VPS, enabling you to monitor and diagnose the node's performance.
More information about the Erigon support command can be find here.
5. Refresh the Diagnostic Tool
Once the Diagnostics Tool is successfully connected to the Erigon node, return to your web browser and reload the page. This step is necessary to query data from the connected node.